Periodic Table Web Quest
Complete the following Web Quest with your group. Instructions and resources can be found at: http://zunal.com/webquest.php?w=262668
Part 01 - The History of the Periodic Table
The Periodic Table is one of the most recognizable aspects of chemistry. Likely, you have been using the Periodic Table for several years now and are mostly comfortable with determining things like the atomic number, atomic mass and the element symbol. But it turns out that there is significantly more to the Periodic Table than first meets the eye! In this unit, we are going to take a closer look at the Periodic Table and identify different trends and patterns that exist as a result of the way that the Periodic Table is organized. But before we can get to all of that, let's review the origins of the Periodic Table...
|
Krypton Periodic Table
The lab on the left was completed in class. What trends did you observe in boiling point, melting point, state of matter, atomic mass, etc. across rows? What about down periods? | ||
Much like you did in the activity above, scientists struggled for a while to organize the elements in a way that made sense. By the 1860s, there were over 50 known elements that scientists had discovered and characterized. In doing so, they had discovered that many of the physical and chemical properties of elements had repeating patterns and they theorized that if ordered correctly, the properties of elements would repeat in a system and predictable way. This idea was known as the law of periodicity. There were many different systems of organization proposed by many different people; however, we are going to limit our focus to the contributions of just two scientsits. The first was a scientist named Dmitri Mendeleev. Mendeleev proposed a periodic table in 1869 that organized the elements into a table in order of increasing atomic mass. Along with his table, Mendeleev used the repeating patterns that he had discovered to very accurately predict the properties of several elements that he proposed were missing from the table - gallium, germanium and scandium. For his work, Mendeleev is often referred to as the "father of the periodic table." In 1913, Henry Moseley, discovered that the properties of elements were actually more of a function of the elements' atomic numbers than of their atomic masses. This discovery helped reshape the periodic table so that it is ordered by increasing atomic number rather than by increasing atomic mass. While the table ended up being very similar to Mendeleev's, Moseley's revision helped fix a few flaws in Mendeleev's ordering and made him able to identify places for several missing elements that were not actually known about within his lifetime.
Part 02 - Basic Trends in the Periodic Table
The periodic table is arranged in such a way that many of the physical and chemical properties of the elements can be predicted based on their position in the periodic table. The following are all Periodic Table trends that can see on the periodic table:
The periodic table is arranged in such a way that many of the physical and chemical properties of the elements can be predicted based on their position in the periodic table. The following are all Periodic Table trends that can see on the periodic table:
- Atomic Number - The most noticeable trend on the periodic table is the atomic number. The atomic number represents the number of protons in one atom of that element. (In a neutral atom of that element, this will be equal to the number of electrons.) The atomic number is the primary way in which the periodic table is organized. As such, you will notice that the atomic number of elements increases from left to right across a period and from top to bottom down a group.
- Atomic Mass - One of the original periodic tables (designed by Dmitri Mendeleev) was actually organized in order of increasing atomic mass. You will notice this trend is mostly maintained on the current periodic table, however, there are a few exceptions and the modern table is officially arranged in order of increasing atomic number instead. The atomic mass of the elements increases from left to right across a period (with a few exceptions) and from top to bottom within a group.
- Number of Valence Electrons - The number of valence electrons that an element has can be easily determined by its group number if the element is a representative element (meaning that it is a member of Groups 1A-8A). For representative elements, the number of valence electrons is equal to the group number (Group 1A elements have 1 valence electron while group 5A elements have 5 valenece electrons). Unfortunately, this trick doesn't work for the transition elements (which don't follow the octet rule). So within a period, the number of valence electrons will increase from left to right (and correspond to its group number) while within a group the number of valence electrons will be the same.
- Boiling Point and Melting Point - Melting points and boiling points of elements follow the same trend on the periodic table. As you move from left to right across a period you will notice the melting and boiling points decrease. As you move from top to bottom, down a group, you will notice the melting and boiling points increase. Remember though (and this includes all of these trends) that this a pattern that is generally true. You will find exceptions to most of these trends on the periodic table and there are certainly several exceptions for melting and boiling point.
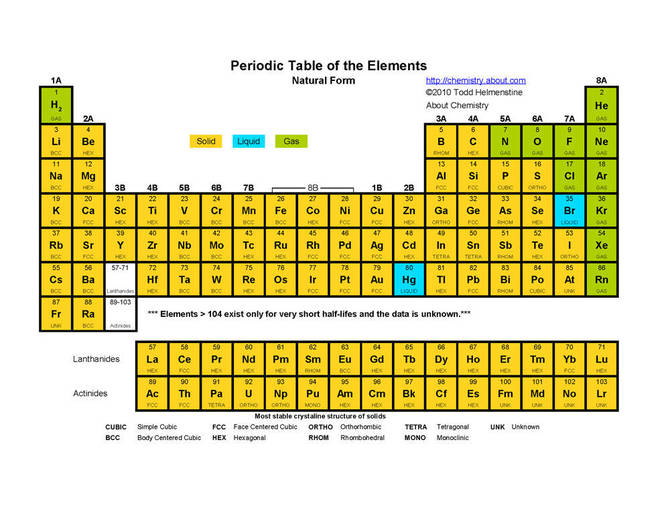
- State of Matter - Closely related to boiling point and melting point is states of matter at room temperature. Elements on the left of the periodic table and more towards the bottom are more likely to be solid at room temperature while elements to the right and more towards the top are more likely to be gases at room temperature. The periodic table contains surprisingly few elements that are liquids at room temperature (Bromine and Mercury).The periodic table below illustrates the distribution of the different states of matter in the Periodic Table.
- Density - So what about density anyway? Use the lab below to explore this trend for yourself. Can you establish how density changes within a group on the periodic table?
|
Density of Elements in a Group
The lab to the left was assigned in class to determine the densities of elements within group 4A of the periodic table. What trend do you notice for density within a group on the Periodic Table? | ||
|
Apply - Periodic Table Trends I
The worksheet to the left was assigned in class to practice using the periodic table trends of melting point, boiling point, state of matter, electrical conductivity, magnetism, number of valence electrons. | ||
Part 03 - Types of Elements on the Periodic Table
Because of the way that the periodic table is arranged, the elements of the table are largely grouped into 3 different "types."
Metals
Metals
- Metals are found largely on the left side of the periodic table as seen in the image below. Most metals have high boiling and melting points and are solids at room temperature (with the exception of Mercury which is actually a liquid at room temperature!). Metals also tend to be good conductors of heat and electricity and many of them are magnetic. Additionally, metals have some unique properties that are typically characteristic of metals. Metals are lustrous - meaning that they are shiny. Metals are ductile - meaning that they can usually be pulled into thin wires. And lastly, metals are malleable - meaning that they can be hammered or pressed without being broken or cracking.
- Metalloids are found along the staircase-like line on your periodic table. Metalloids share some of the properties of metals and some of the properties of nonmetals, and are therefore, sometimes referred to as semi-metals. The metalloids include boron, silicon, germanium, arsenic, antimony and tellurium (and polonium is sometimes considered a metalloid as well). Metalloids tend to have higher melting and boiling points than non-metals. Like metals, they are lustrous and conduct heat and electricity (although not as well as metals so they are often referred to as semiconductors). However, unlike metals, metalloids tend to be brittle and nonmagnetic.
- Lastly, on the far right of the periodic table, we have the nonmetals. The nonmetals tend to have lower melting and boiling points than metals and metalloids. Because of this, many of the nonmetals are gases at room temperature (hydrogen, nitrogen, oxygen, fluorine, chlorine and all of group 18), one element (Bromine) is a liquid and the rest are solids. Of the elements that are solids, they are brittle solids unlike metals which are usually ductile and malleable. Nonmetals often tend to be dull in color and lack the luster of metals and metalloids. They are poor conductors of heat and electricity and are usually not magnetic.

Part 04 - More Advanced Trends in the Periodic Table
|
Graphing Periodic Trends
The activity the right was begun in class and finished for homework. In this activity, you will use experimental data for ionization energy, electronegativty and atomic radius size to determine the trends in the periodic table for each. |
| ||
|
Apply - Periodic Table Trends II
The worksheet to the left was assigned in class to practice using the periodic table trends of atomic radius size, ionization energy and electronegativity. | ||
