Unit 01 - A Drop of Chemistry
Part 01 - Just a Splash
Welcome to Chemistry! I hope that you are every bit as excited about this year as I am! Hopefully, you enjoyed our first little chemistry lab and can thoroughly impress your friends and family with your ability to prove whether a water drop slides or rolls! Speaking of that little activity, I've attached it below in case you need a refresher! But what about why? Much later in the year, we'll discuss this, but in the mean time, why do you think that the drop rolls instead of slides?
|
Investigate - A Drop of Water
The investigation on the left was performed in class. | ||
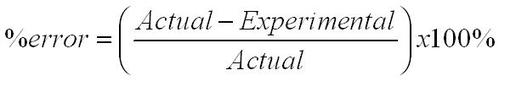
But we can take our study of water drops at least one step further by attempting to determine the actual mass and volume of a single drop of water! This was a bit of a challenge, right?! Did you have any idea that water drops were so small??? Despite the difficulty, how accurate was your group and how precise was your data? Remember - accuracy refers to how close a measured value is to the actual value and precision refers to how close together your measured values are (regardless of their accuracy). But it's hard to prove how much better than your neighbor that you were without being able to quantify your accuracy, right? That's why we use percent error! Percent error is a measure of the discrepancy between a measured (experimental) value and the actual value. Percent error is calculated by using the following formula:
|
Investigate - Mass and Volume of a Drop of Water
The investigation on the left was performed in class to determine the mass and volume of a single drop of water from a pipet. | ||
|
|
Interactive Notebook Pg. 1 - Accuracy and Precision
Use the video on the left to review and or make up the notes in your Interactive Notebook for Accuracy and Precision. |
Part 02 - Making Things a Bit More Dense...
I'm sure that you remember density calculations from your previous science classes. Density is the mass per unit volume and is usually expressed in g/cm3 or g/ml. (Of course using unit conversions you could express density in any unit of mass divided by any unit of volume!)
Hint:
The volume of a cube can be easily calculated by measuring the length, width and height and then using the formula Volume = L x W x H. But what if you are given an irregularly shaped object for which you have no formula for volume? For irregularly shaped objects, you'll need to determine the volume by using water displacement. Water displacement is a technique in which a volume of water is placed in a graduated cylinder and measured (Don't forget! We always measure clear liquids by reading the volume at the bottom of the meniscus. The meniscus is the curved upper surface of a liquid that is poured into a cylinder). The object is then placed into the water and the volume of the water is displaced (or increases) by the exact volume of the object that was placed in it. Therefore, in order to determine the volume of the object, you only have to subtract the final volume of the water from the initial volume of the water! Need a visual example? Check out the picture to the right. Isn't that easy?! |
Investigate - Density
The lab on the left was performed in class. Students designed an experiment to determine the density of different objects. Make sure that you keep up with those density values! You might need them later! 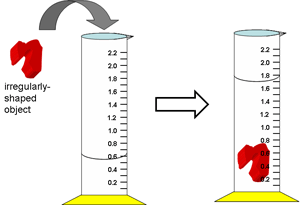
| ||
Now here is where we disagree with your math teacher (but don't tell them that I said so!). See your math teacher might let your write numbers to as many decimal places as you'd like, or maybe they have a convenient rounding rule that you always use. But we are chemists! And chemists are accurate and precise all the time! So we of course have rules about the number of digits that we actually keep. Remember, that in Chemistry, measured values come from the lab and are the product of different pieces of equipment that have different levels of accuracy and precision. For example, the digital balances that we use in the lab are more accurate than most old triple beam balances, but they are less accurate than our nice analytical balance. Therefore, those three devices will not report the exact same data. The triple beam balance might tell you that a rock has a mass of 14.2 g while the digital balance might read 14.16 g and the analytical balance might say 14.149 g. For this reason, we use significant figures in chemistry. Significant figures are those digits in a number that confer meaning about the precision of a value. In order to determine which digits in a number are significant, use the following rules:
#1) 5.40 _________ #6) 1.2 x 10^3 __________
#2) 210 _________ #7) 0.00120 __________
#3) 801.5 _________ #8) 0.0102 __________
#4) 1000 _________ #9) 9.010 x 10^-6 __________
#5) 101.0100 _________ #10) 2370.0 __________
Key: #1) 3 #2) 2 #3) 4 #4) 1 #5) 7 #6) 2 #7) 3 #8) 3 #9) 4 #10) 5
- All non-zero digits are significant
- Zeroes that are between significant figures are also significant
- Final zeroes after a decimal are significant (for example, in the number .5980, the 0 at the end is significant)
- Leading zeroes are not significant (for example in the number 0.00431, the first 3 0s are not significant)
- All of the digits in the coefficient of a number written in scientific notation are significant.
#1) 5.40 _________ #6) 1.2 x 10^3 __________
#2) 210 _________ #7) 0.00120 __________
#3) 801.5 _________ #8) 0.0102 __________
#4) 1000 _________ #9) 9.010 x 10^-6 __________
#5) 101.0100 _________ #10) 2370.0 __________
Key: #1) 3 #2) 2 #3) 4 #4) 1 #5) 7 #6) 2 #7) 3 #8) 3 #9) 4 #10) 5
|
Apply - Significant Figures
The assignment on the left was given in class to practice counting significant figures and reviewing scientific notation. | ||
|
Measuring with Significant Figures
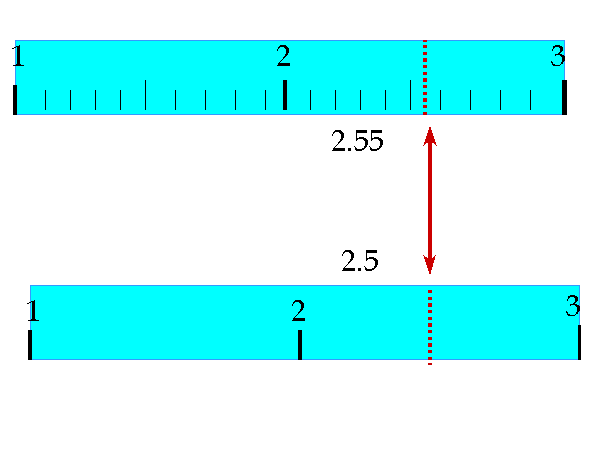
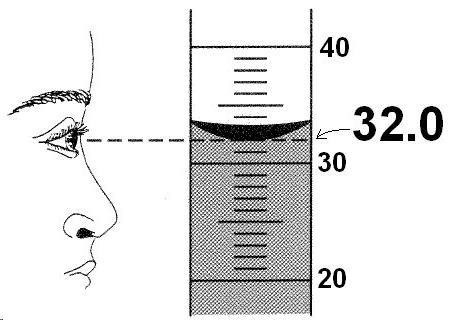
But where do those digits come from in the first place? When you take measurements in the lab, the numbers that you write down should be based on the use of significant figures. Therefore, we want to make sure that our measurements are as accurate as they possibly can be and that means estimating our numbers beyond the normal ability of whatever device that we are using to measure. For example, in the images to the right, you can see that the values that are recorded are all estimated to one digit beyond what the device actually measures to. In the example of the rulers, the ruler at the top reads to the nearest tenth of a centimeter. But we can tell that the distance is somewhere in between 2.5 cm and 2.6 cm so we estimate this value to the nearest one hundredth of a centimeter - 2.55 cm. In the example of the ruler below it, it only reads to the nearest 1 cm and since the value is in between 2 and 3 cm, we estimate it to be 2.5 cm. Notice that the estimated digit will either be an extra 0 or 5. Don't try to get fancy and estimate 2.4 cm for the bottom ruler even though it appears that might be closer - our ability to estimate is not precise enough to be consistent. In the image below, you can see how the volume of a liquid is measured in a cylinder using significant figures by again estimating one extra digit beyond the graduations on the cylinder. This time the measurement is closest to 32 (rather than being in between two numbers) but we still estimate 1 extra digit and record the value as 32.0 ml. |
|
|
|
Interactive Notebook Pg. 2 - Significant Figures (Digits)
Use the video on the left to review and or make up the notes in your Interactive Notebook for Significant Figures. |
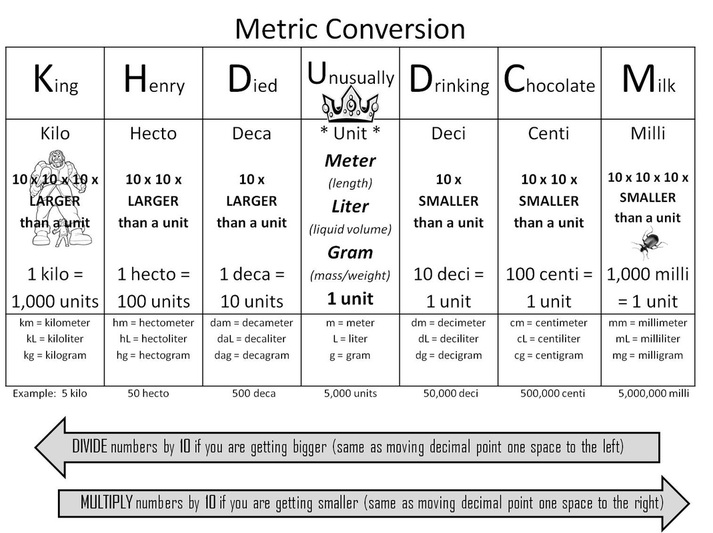
Unit Conversions
This might be a good place to put a reminder about unit conversions. Don't forget that in science, we always use metric units (which we call SI units). The chart below will be helpful in reminding you how to convert between SI units.
This might be a good place to put a reminder about unit conversions. Don't forget that in science, we always use metric units (which we call SI units). The chart below will be helpful in reminding you how to convert between SI units.
Preserving Precision in your Calculations
Whenever we perform a calculation with measured values, we have to ensure that our answer does not convey more or less precision than our measurements. In other words, when performing a calculation, my answer can only be as precise and accurate as the measured values that go into it. Therefore, we have some rules for how to round our answers when we perform calculations in Chemistry.
Rules for Rounding when Calculating with Measured Values:
1. When adding or subtracting, always round your answer to the same number of decimal places as the number with the fewest decimal places.
2. When multiplying or dividing, always round your answer to the same number of significant figures as the number with the least number of significant figures.
Be careful to pay attention to the subtle difference in wording between these two rules. Need an example or two to help this make sense? Check out the videos below which show example problems as well as the Interactive Notebook notes.
|
|
Interactive Notebook Pg. 3 - Rounding and Calculations with Sig Figs
Use the video on the left to review and or make up the notes in your Interactive Notebook for Rounding and Calculations with Significant Figures. Additionally, there is another video below that shows 4 more examples of performing calculations and rounding for significant figures with measured values. Make sure that you have mastered this skill since ALL of our calculations for the entire year will need to be rounded to an appropriate number of significant figures! |
|
Example Calculations with Rounding for Sig Figs
In the video to the right, you can see 4 different examples of problems in which we have performed a calculation and rounded for significant figures. Remember to never do intermediary rounding (which means rounding in the middle of a problem). |
|
|
Apply - Significant Figures in Calculations
The worksheet to the left was assigned for homework to practice performing calculations with measured values and rounding to the appropriate number of significant figures. |
Part 03 - Another Dimension
In class you were asked to solve the following problem:
A water faucet dripped continuously at the rate of 215 drops a minute. The volume of the water drop was found to be 0.050 mL. Find the money lost each day due to this leak given that the city water charges were $85.86 for 5000 gallons of water. (1.00 gallon = 3.785 L)
Chemistry is full of problems like the one above that require multiple unit conversions / ratios. In truth, the problem above is simple (most you were probably able to solve it in class) but can be time consuming. In order to simplify these problems even more and make them much faster to solve, we use dimensional analysis. Dimensional analysis is a method of solving problems by comparing the units of different conversion factors. and canceling them out so that you are only left with the unit that you desire. If you need some extra help with dimensional analysis, use the online tool found below to help you solve problems. This calculator will help you check and make sure that your unit conversion factors are set up right and can be canceled before giving you an answer. Try it out! (Disclaimer: This tool is not mine. I find that some students find it helpful, but there is a small learning curve to use it. If it doesn't work for you, don't stress over it. Feel free to use all of the other resources at your disposal instead.)
Dimensional Analysis Calculator- One Unit Factor
This script is a major modification Dr. Nikita Matsunaga of Long Island University 1998 dimensional analysis web page by John Taylor of LSUA.
Additional modifications were added by Al Falkenstein of of falkensteins.info
|
Interactive Notebook Pg. 4 - Dimensional Analysis
Use the video on the left to review and or make up the notes in your Interactive Notebook for Dimensional Analysis. If you're having trouble with the Apply - Dimensional Analysis worksheet below, there is a video example below it that shows question #3 being solved. |
|
|
Apply - Dimensional Analysis
The worksheet to the right was assigned in class to help students practice Dimensional Analysis. If you find that you are having any trouble with the assignment, make sure that you try and use the calculator above to help you solve the problems! |
| ||
|
|
Apply Dimensional Analysis #3
In the video to the right, you can see an example problem (#3) worked from your Apply - Dimensional Analysis homework. Use your interactive notebook to help you solve the problem. |
|
Investigate - Thickness of Aluminum Foil
This lab was assigned in class. Students calculated the thickness of aluminum foil using all of the scientific processes and skills learned above. How low was your groups percent error? | ||
Part 04: Lab Safety
A safe year in Chemistry is going to be a great year in chemistry! Help make sure that this year proceeds problem free by following all of the lab safety rules that we discussed in class! (And NEVER behave like the students in the What-Sa-Matta Laboratory!)
Can you remember all of the problems that we identified in the picture above?
|
In addition to all of the rules that we reviewed with the help of the What-Sa-Matta Laboratory students, you also should be familiar with all of lab safety rules and procedures in the Flinn Safety Contract to the right. Don't forget that you must have this file signed by yourself and a parent/guardian and permanently glued into your Interactive Notebook in order to participate in labs!
|
| ||
|
|
Interactive Notebook Pg. 5 - Lab Safety
Use the video on the left to review and or make up the notes in your Interactive Notebook for Lab Safety. The Flinn Student Lab Safety Contract can be found above. Don't forget to have it signed by a parent or guardian AND yourself! |
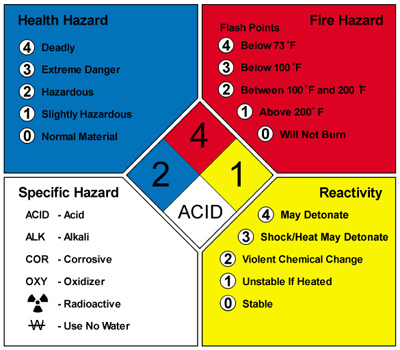
Material Safety Data SheetsRemember why that locked box in the image above is problematic? It contains all of the lab's MSDS (Material Safety Data Sheets) and should be easily accessible to everyone in the lab! Of course, that doesn't do us much good if we don't know how to get information off of an MSDS. The activity to the right was completed in class to help learn how to use an MSDS and what type of information can be found on one.
|
| ||||||
|
|
Interactive Notebook Pg. 5 - Lab Safety
Use the video on the left to review and or make up the notes in your Interactive Notebook for Material Safety Data Sheets. The MSDS Activity that is glued into the left side of your notebook can be found above along with the necessary MSDS files. The MSDS example template that is glued into the left margin of the right side of your notebook can be found above as well. Finally, the example NFPA chart that is used can be seen below. Feel free to print this image to use in your lab notebook (as a special bonus, this one is in color). |